Generative BI: How generative AI changes the data analysis experience
Revolutionizing Business Intelligence: The Era of Generative AI
Business Intelligence (BI) has undergone a remarkable evolution, progressing from its pre-digital roots to the present era. Initially focused on facilitating smart decision-making through data, BI has adapted alongside technological progress, transitioning to digital storage and computer-driven analysis.
In the 2010s, BI took a significant step forward with dashboards and visualizations, yet insights remained elusive. Recent advancements like search-based analytics and augmented analytics eased the process but still required users to formulate precise queries. Now, we're witnessing the emergence of Generative BI, a transformative approach leveraging Generative AI. This revolution ensures not just answers to queries but insights users might not have considered. It democratizes intelligence, making it accessible to all, not just data experts. Generative BI accelerates decision-making, marking a shift from basic data analysis to advanced, proactive business intelligence.
Challenges of Traditional BI and the Promise of Generative BI
Traditional BI tools face various challenges:
- Hidden Insights: Valuable insights are buried in complex interfaces.
- Implementation Complexity: Lengthy setups limit widespread adoption.
- Static Dashboards: Lack of adaptability leads to delayed responses.
- Incomplete View: Fragmented data impedes informed decisions.
- Low Adoption: Restricted to data-savvy individuals.
Generative BI, powered by generative AI, effectively addresses these issues:
- Automated Insight Generation: Predicts needs, saving time.
- Quick Implementation: No-code setup facilitates swift deployment.
- Dynamic Insight Delivery: Personalized feeds surpass static dashboards.
- Unified Data Aggregation: Provides a holistic view, overcoming fragmentation.
Generative BI transforms raw data into strategic insights, offering an efficient and unified perspective. This innovation propels business intelligence into a more accessible, efficient, and insightful future.
Use Cases
While those with an engineering or analyst background might find handling data and generating reports straightforward, for humanities-oriented managers, it's no easy task. Particularly, integrating data scattered across SaaS tools and application databases is something one would prefer to avoid, wouldn't they?
On the other hand, leveraging data for swift decision-making and progressing business through PDCA cycles is crucial. This time, I'll introduce an easy way to visualize the desired metrics on the spot using Morph, even for those uncomfortable with data. Specifically, we'll explore how to integrate Salesforce's customer data and Stripe's payment data to visualize various metrics like MRR along different axes. Let's dive in!
Morph’s Real-Time Aggregation and Visualization of Sales KPIs Visualizing SaaS Metrics by Combining Salesforce and Stripe Data
Datasets Used:
Salesforce:
- Account Data
- Contract Data
- User Data
Stripe:
- Customer Data
- Invoice Data
We'll utilize the above data to visualize SaaS metrics.
1.Setup (Importing Data from Each SaaS to Morph)
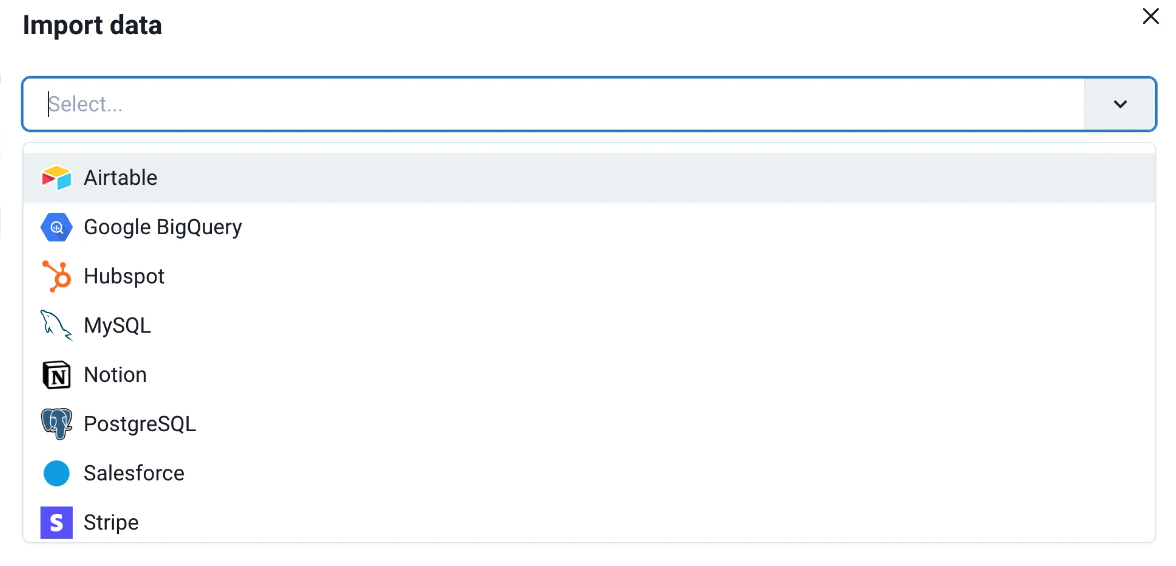
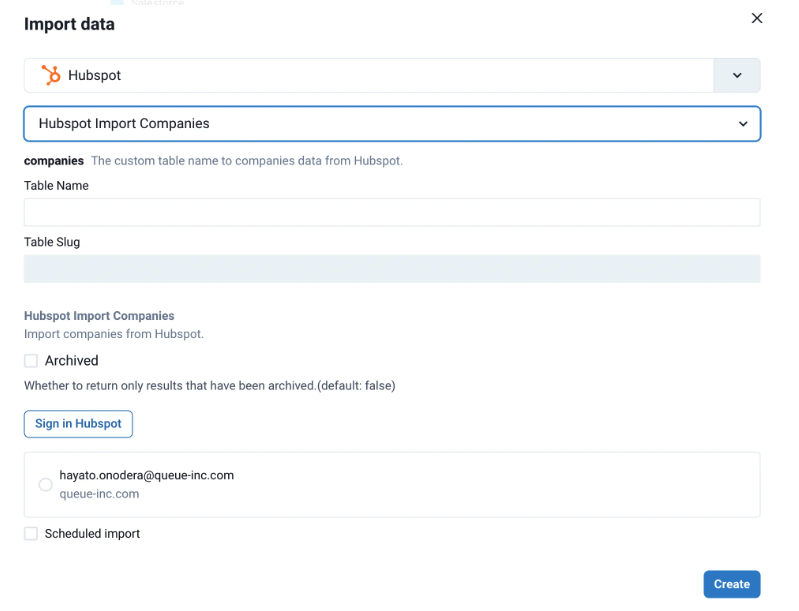
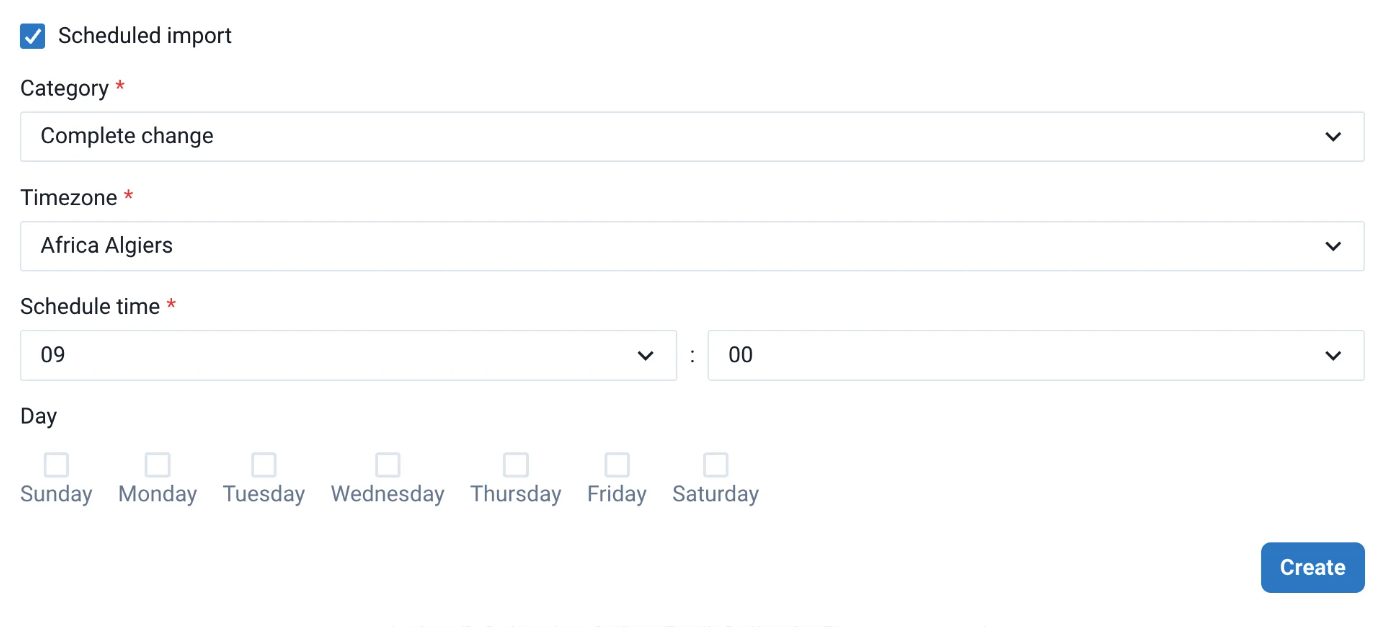
Previously, we either requested engineers for the necessary datasets or downloaded CSVs from each SaaS interface. However, with the method introduced this time, that's no longer necessary. Simply select the SaaS data source you want to import from Morph's Import screen and click the Import button (See Figure 1). By setting up a schedule (See Figure 2), the data will automatically be kept up-to-date at regular intervals.
2.Integrate the Imported Tables
We'll integrate the tables necessary for analysis. Similar to Excel's lookup function, you can integrate specific fields by using natural language. Here, we'll try instructing integration using natural language.

3.Conduct Analysis and Visualization in Natural Language on the Integrated Table
The integrated table has all the necessary items for analysis. Now, we'll provide instructions for analysis and visualization in natural language. For example, let's present metrics like the one below.

If asked in a meeting, "I want to see the breakdown by customer," let's modify the instructions as follows.

Conclusion:
In this way, even for those uncomfortable with analysis, you can easily and quickly visualize using everyday language. You can respond on the spot if a new metric request comes during a meeting! No more stomach-churning preparation is needed!Morph offers a free trial. If you're interested, you can sign up here.