Morph 1.0: the all-in-one database, analysis tool, and dashboard
With this new version, we provide an all-in-one tool that can handle all of the data tasks in a business, without the need for coding, database knowledge, or data analysis expertise.
Morph can provide:
- a scalable database capable of handling data volumes of up to one million rows
- an analysis tool that allows data analysis to be performed through natural language and visual tools
- a dashboard where results can be freely arranged and shared via URL
As anyone who has worked with data operations will know, up to now these functions have required the use of disparate tools; and to link the results needed the building of custom data pipelines via SQL and APIs. This dispersion of tools leads to huge construction costs and time buffers for change requests, and is one of the fundamental problems of a modern workflow. In Morph, data storage, analysis, visualization, and utilization are seamlessly linked and designed so that everyone can work with the data — without the need for complex set-up or expertise.
New features and functions
Notebook has evolved into Canvas!
Morph Beta offered Notebook as a place for data analysis. Notebook was designed in the image of Jupyter-like tools such as Google Colab, and this metaphor was acceptable to people such as software engineers who have worked with Jupyter. However, we felt that this was not enough.
With this update, we tried two things. The first was to make Morph more manageable for non-developers. The second was to make our features more flexible and answerable to different requirements. In realizing these ideas, we were greatly inspired by online whiteboards such as FigJam and Miro.
As a result, Notebook was reborn under the name 'Canvas' with the following features:
- Two-dimensional degrees of freedom
- A wide array of cell types
- Non-linear processes that can be freely branched
- Seamless connection to multiple data sources and dashboards
Two aspects of Canvas: the Playground and the Dashboard
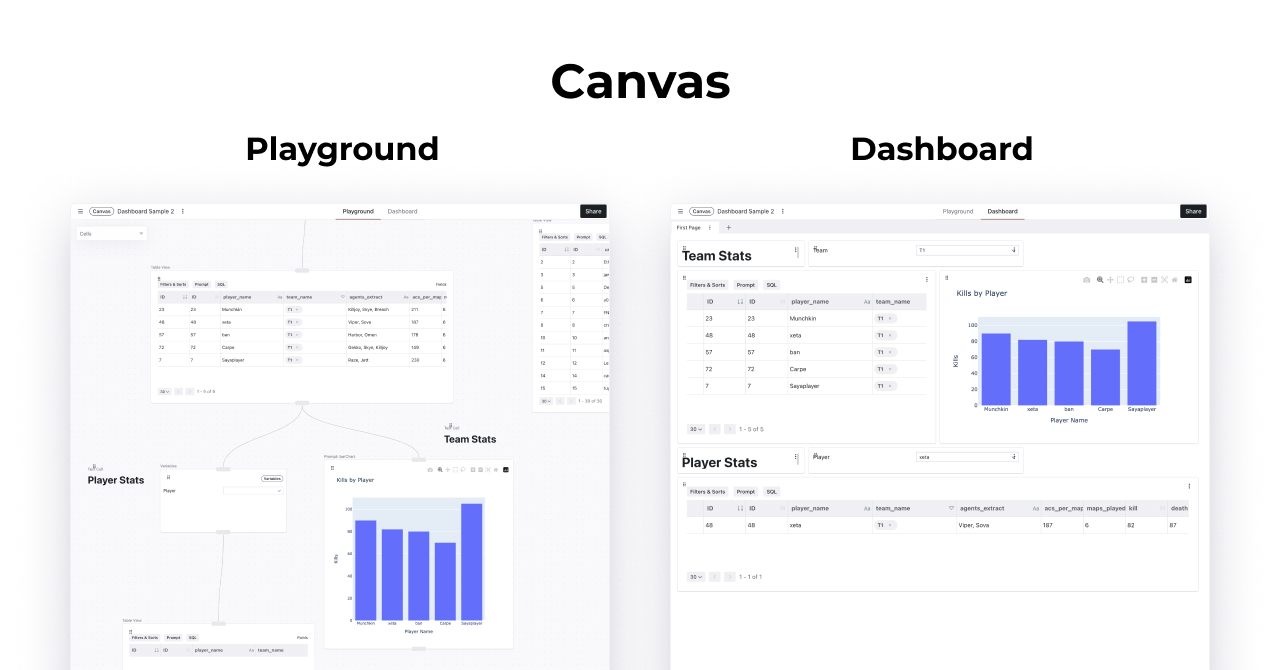
Canvas has two aspects.
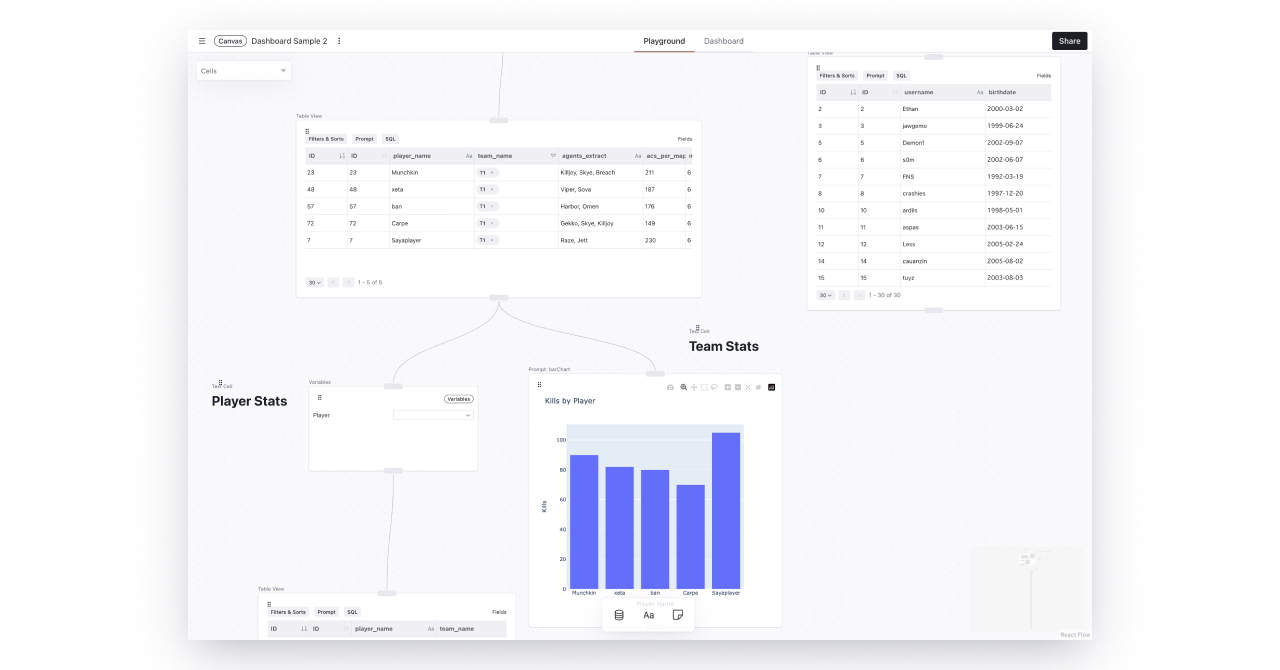
The first is named Playground. This is a whiteboard for organizing data and performing analysis, where the whole team can freely leave intermediate steps and comments. The other we call Dashboard. This allows cells created in Playground to be placed on tiles and can be used as a BI tool.
Using Canvas is simple:
- add data from a data source — imported sources from external tools such as Salesforce and Stripe are also supported
- create a table view from the source and provide data formatting conditions. Condition parameters can be set or data can be shaped by an AI query
- create a chart from the table view using AI visualization cells
- add the desired results to the Dashboard
Variable cells in Canvas: a whole new idea for flexible and understandable BI
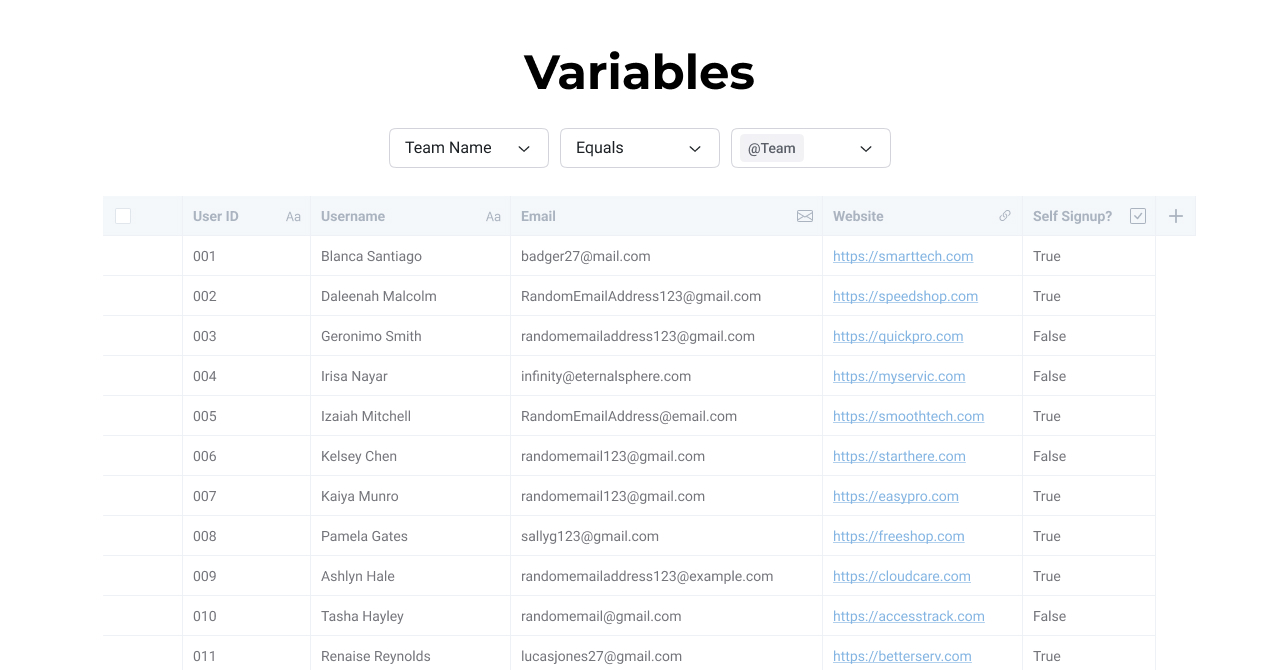
In Canvas, you can work with a new cell type called variable cells. These variable cells can be referenced from other cells, where changing the value of a variable cell changes the display of a table or chart. This ability to change the results of data analysis on demand is a feature found in many BI tools, but was not offered in the Morph Beta. However, existing BI tools also have problems. Setting up variables to change results in this way often requires very complex setups. Variable cells in Canvas, on the other hand, are very simple: you can place a variable cell in the middle of a pipeline created in Canvas, and in a table view cell or AI visualization cell you can call the variable by typing "@".
Sharing through URLs and embedding in the Dashboard
Dashboard builds can be distributed via URL or embedded in tools such as Notion to share with your team.
Similarity search: AI search by meaning
Morph uses generative AI techniques to make data easier for non-developers to work with. The two AI functions we have developed and provided so far are:
- AI Query: a feature that allows users to query database content using natural language
- AI visualization: the ability to perform chart creation with natural language prompts
Morph 1.0 adds a new AI feature called Similarity Search. As the name suggests, this is a feature that enables 'record search by meaning', which can be performed on data sources. I would like to explain a little about why this is a special feature.
In general, data retrieval is determined by content matches. For example, suppose you have a data source that contains a list of country names. To search for 'Canada' in that list, you can narrow down the search by entering the letters 'C,' 'Can,' 'anada,' etc. This is because you are querying using a portion of the string contained within the search target. With similarity search, the search term 'North America' can be used find 'Canada.’ As the name suggests, this is because the similarity between the two is determined by meaning. Let's consider a more realistic example. Suppose you are a sales manager and you keep records of business meetings. If you wanted to narrow down the list of business meetings with positive reactions, how would you search for them? You might try searching for the string 'positive reaction', but if there is no such notation in the record, there will be no hits. With similarity search, such queries work as expected. This is why search by similarity is powerful: it allows you to search by meaning, rather than by rote description.
Further updates planned
But this release is not all! Morph has several updates in the pipeline:
Expanded presets for AI visualisation
We currently have several chart presets, such as bar charts and pie charts, but we will offer a wider variety of chart formats. At present, you can still get a completely free format output by selecting 'free form', but presets will make it more controllable.
Expanded rights management
Currently, you can set permissions for individual data sources or for Canvas as a whole, but we will offer more granular permission settings in the future.
Smart Fields
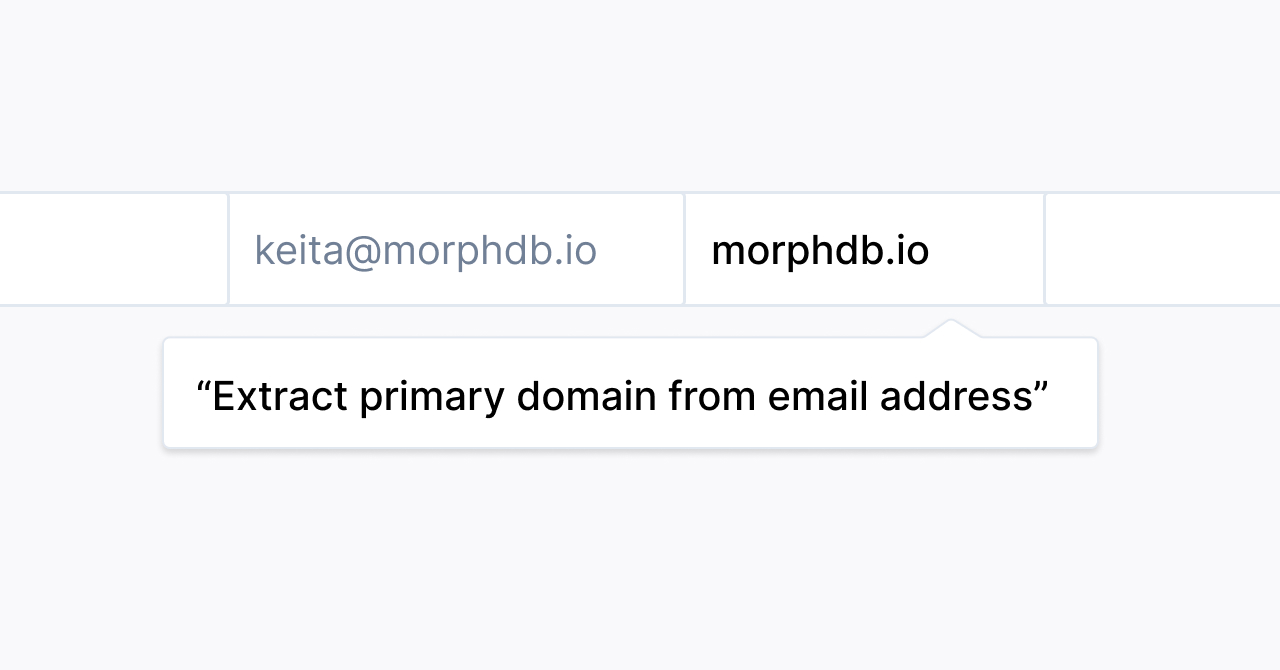
A new field type is planned: Smart Fields, which will store the result of the execution of an instruction by a prompt. This will be configurable for different data sources.